
Lessons Learned
“Safety
Zone” newsletter, July, 2004
Lessons Learned —
author, date unknown
One-Year Anniversary Letter
by Kelly Close, FBAN
Declaration on Cramer
Redactions, by James Furnish, April, 2005
FSEEE v. USFS, FOIA
Civil Lawsuit Order,
December, 2005
FOIA
Request to USFS, December, 2005
FOIA Appeal to USFS,
February, 2006
Management Evaluation Report
Investigation Team Information
Synopsis of the
Cramer Fire Accident Investigation
Causal Factors
Contributing Factors
Addendum
Factual Report
Executive Summary
Narrative
Background
(facts 1 - 57)
Preaccident
(facts 58 - 201)
Accident
(fact 202)
Postaccident
(facts 203 - 237)
Findings
Appendix A
Resources on the Fire
Appendix B
Cramer Fire Timeline
Appendix C
Fire Behavior and Weather
Prior Conditions
Initial Phase
Transition
Phase
Acceleration
Phase
Entrapment
Phase
Appendix D
Equipment Found at H-2 and the Fatalities Site
Appendix E
Fire Policy, Directives, and Guides
OIG Investigation
OIG FOIA Response,
February, 2005
2nd FOIA Request to OIG,
April, 2006
2nd OIG FOIA Response,
August, 2006, (1.4 mb, Adobe .pdf file)
OSHA Investigation
OSHA Cramer Fire Briefing Paper
• Summary and ToC
• Sections I-IV
• Sections V-VII
• Section VIII
• Acronyms/Glossary
OSHA South Canyon Fire
Briefing Paper
Letter to District
Ranger, June 19, 2003
OSHA Investigation Guidelines
OSHA News Release
• OSHA Citation 1
• OSHA Citation
2
• OSHA
Citation 3
USFS Response
OSHA FOIA Letter
Adobe PDF and Microsoft Word versions of documents related to
the Cramer Fire can be downloaded from the U.S.
Forest Service website.
|
Accident Investigation
Factual Report
Cramer Fire Fatalities
North Fork Ranger District
Salmon-Challis National Forest
Region 4
Salmon, Idaho - July 22, 2003
Appendix C—Fire Behavior and Weather
Entrapment Phase, July 22 (1500 to 1524)
By 1500, the short wave disturbance had moved over the fire area. It
brought strong winds from the northwest, shifting to westerly, that overpowered
local diurnal winds. Driven by these strong winds, the fire began to make
rapid, intense runs simultaneously in Cramer Creek and the Cache Bar drainages.
At H-1, gusts up to 30 mph were reported, and crews in that area moved
into the black as a safety zone. In Cramer Creek, the fire intensity was
rapidly building on the northwest perimeter, and transitioned from a surface
fire to a crown fire as windspeeds increased and the fire encountered
more continuous crown fuels. A large, brown column formed in the Cramer
Creek drainage, pushing vertically to 12,000 feet and moving eastward
toward the town of Salmon, ID.
An active, moving fire front had become established in the bottom of
the Cache Bar drainage (figure 25). Pushed by strong winds, the fire front
began to move upcanyon toward H-2. As the wind shifted to a more westerly
flow, winds aloft began to align with the Cache Bar drainage. The fire
moved rapidly upcanyon (figure 26), with spread rates and intensities
much greater than witnesses had expected. Preliminary modeling indicated
that during the early part of the run in the drainage bottom, the fire
was moving through the ceanothus brush at a rate of 80 to 90 feet per
minute with flame lengths up to 9 to 12 feet.
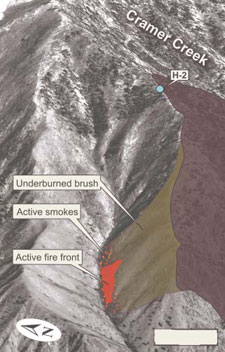
Figure 25—Between
1430 and 1440, smokes in the bottom of the Cache Bar drainage turn into
a flaming front.
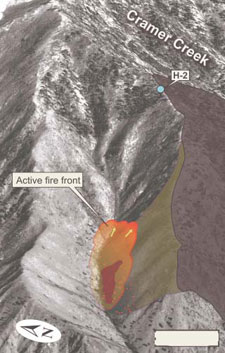
Figure 26—At 1500,
a fire front begins to move upcanyon and up to the base of the slope below
the West Ridge.
As the fire advanced up the Cache Bar drainage, it began to burn up the
slope below the West Ridge through green and underburned brush and downed
woody fuels (figure 27). The entire upper portion of the Cache Bar drainage
erupted into flames which ran uphill. Flame lengths averaged 20 feet in
brush and 50 feet at the leading edge. The fire was not one solid front,
but simultaneous movement of smaller fronts that followed stringers of
more continuous fuels. When the fire encountered rocky areas on the slope,
the fire front did not stop—flames swept over them as if the rocks
were burning as well. Postfire modeling indicates the spread rate was
130 to 150 feet per minute (fuel model 6), consistent with witness descriptions
of the event (figure 28). Actual flame lengths witnessed and evidenced
by tree/snag bole scorch height exceeded that predicted for fuel model
6. This may have been partly due to the brush being dried and preheated
by the backing fire earlier in the day.
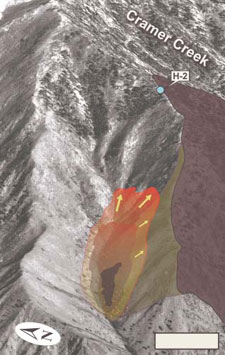
Figure 27—Between
1513 and 1520, the fire front intensifies and continues to move upslope
below the West Ridge.
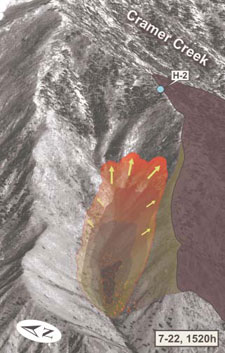
Figure 28—At 1520,
the fire front, based on a model projection, reached the base of the ravine
below H-2.
At 1520, the fire reached the upper portion of the Cache Bar drainage
that was more exposed to the prevailing winds. An elevation profile of
this area shows the exposure of the slope below H-2 to prevailing northwest
winds (figures 29 and 30). Winds at H-2 were estimated at 20 to 25 knots.
The entire upper portion of the drainage appeared to erupt simultaneously
into flames, moving rapidly upslope and updrainage as a “big flash
front.”
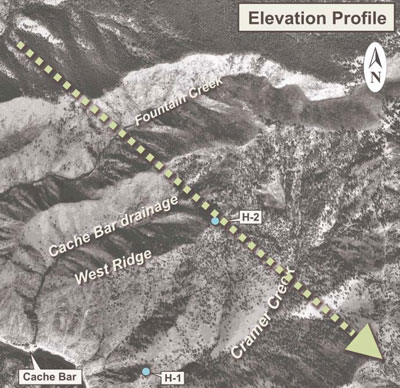
Figure 29—Location
of elevation profile line in figure 30.
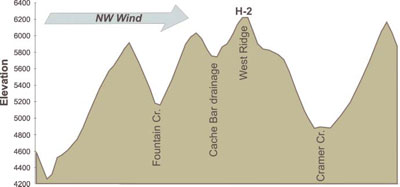
Figure 30—Elevation
profile along a line from northwest to southeast, running through H-2.
The air attack pilot noted that as the fire in the Cache Bar drainage
increased in intensity after 1500, strong indrafts were produced, indicating
extreme burning conditions. At the leading edge of the fire, updrafts
caused the plane to gain 1,000 feet, and at the trailing edge of the fire,
downdrafts would cause the plane to drop 1,000 feet when the plane passed
through those areas.
As the fire increased in intensity and speed and burned up the brush-covered
slope in the Cache Bar drainage, it laid closely against the slope. The
smoke movement also remained close to the slope rather than forming a
more vertical column, rolling over the West Ridge and eventually joining
the main column in Cramer Creek. When the fire front moved into stands
of trees in the upper part of the drainage, it did not immediately consume
the canopies. Crowns at the lower end of these stands were dried, but
not scorched. Bole and crown consumption indicate the flaming front remained
close to the ground, gradually moving higher into the crowns as it progressed
up the slope. The fire did not begin to fully involve the canopy until
about halfway into the stands (figures 31, 32, and 33).
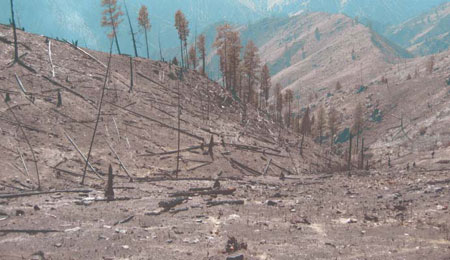
Figure 31—View
of the ravine at the base of the slope below H-2 in the Cache Bar drainage,
from below the stand of trees under H-2.
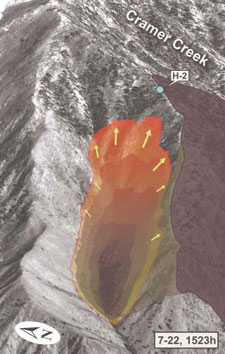
Figure 32—At 1523,
the fire front, based on a model projection, reached the base of the stand
of trees below H-2.
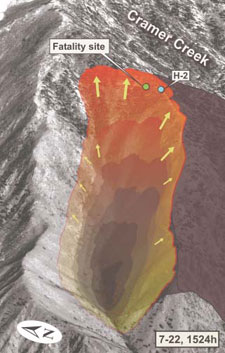
Figure 33—At 1525,
the fire front, based on a model projection, reached H-2.
The descriptions and postfire signs of fire spread in the Cache Bar drainage
indicate the possibility of a phenomenon Richard Rothermel described as
“flame attachment” to a slope. This occurs when fire is burning
on a steep slope and the convection from the fire cannot move away from
the slope. The result is that convective heat and the main part of the
flaming front stay closer to the surface, preheating the fuels and increasing
the intensity of the flaming front as it passes through an area (figure
34). Figures 35 through 38 show crown drying, directional needle and branch
freeze in conifers, and crown consumptions patterns that indicate flame
attachment on the slope below H-2.
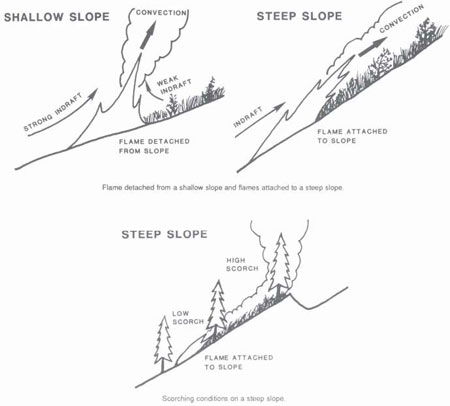
Figure 34—Descripton
of the “flame attachment” phenomenon.—From Richard Rothermal,
1989 BEHAVE fire prediction and fuel-modeling system, BURN subsystem part
2.
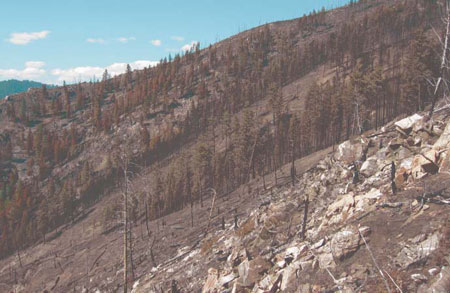
Figure 35—Crown
scorch and consumption in the stand of trees below H-2 (foreground), indicating
flame attachment as described in figure 34.
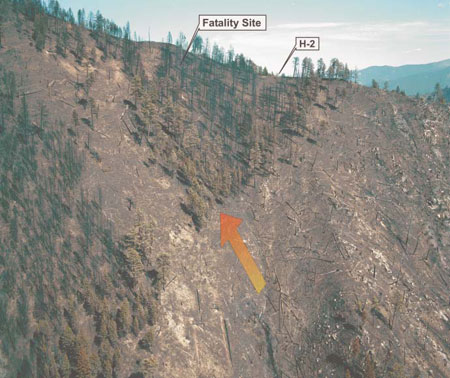
Figure 36—Crown
consumption and directional needle freeze in the stand of trees below
H-2.
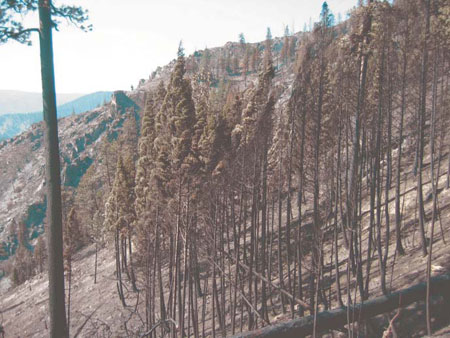
Figure 37—Upslope
needle freeze at the base of the stand of trees below H-2. Crowns were
dried but not consumed by the fire in the lower portion of the stand.
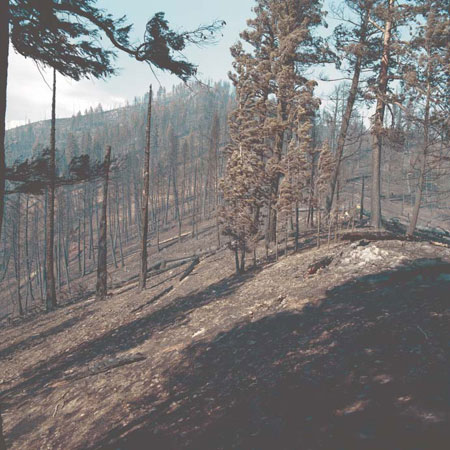
Figure 38—Upslope
needle freeze on the ridgeline immediately west of H-2.
When the fire front reached H-2, postfire site conditions indicate that
surface temperatures were from 1,300 °F to potentially over 2,000 °F in
the crowns. Flame lengths were reported to be 50 to 100 feet as the fire
moved to the top of the stand of trees below H-2 (figure 39). Reports
of spread rates in the upper part of the Cache Bar drainage vary, but
are consistent with the preliminary modeled spread rate of 400 to 600
feet per minute (4.5 to 6.0 miles per hour) during the final run from
the base of the slope below H-2 to H-2.
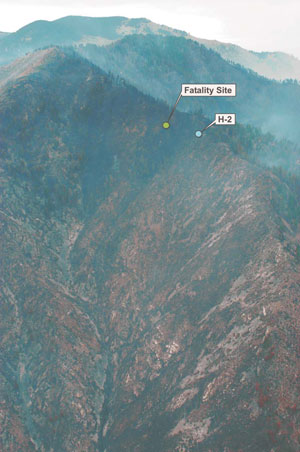
Figure 39—The
upper Cache Bar drainage after the fire front passed.
After reaching H-2, the fire continued to spread beyond the upper end
of the Cache Bar drainage to the east, burning into part of Fountain Creek.
By 1730, all of Cramer Creek had been burned and the fire had moved eastward
into Long Tom Creek. Figure 40 shows the estimated fire perimeter at 1730
on July 22, 2003.

Figure 40—Cramer
Fire perimeter and spread on July 22, 2003, from 1500 to 1730 (estimate).
<<< continue
reading—Appendix D>>>
|