| |

Cramer Fire
|
Accident Investigation Factual ReportCramer Fire Fatalities
|
|||||||||||||||||||||||||||||||||||
Dates of moisture readings
(percent) |
||||
| Vegetation species | July 9 | July 21 | July 26 | July 30 |
| Ponderosa pine (Pinus ponderosa) |
— |
— |
— |
104 to 107 |
| Douglas-fir (Pseudotsuga menziesii) |
— |
112* |
107 |
109 |
| Lodgepole pine (Pinus contorta) |
98 |
100 to 101 |
103 |
— |
| Shiny-leaf ceanothus (Ceanothus velutinus) |
— |
— |
— |
104 |
| Ninebark ( Physocarpus malvaceus) |
— |
— |
— |
85 |
Weather
Hot, dry conditions prevailed from the end of June through July.
Daytime temperatures in the vicinity of the Cramer Fire peaked at over
100 °F at lower elevations, and into the mid 80s at Long Tom Lookout.
Relative humidity (RH) from 10 to 15 percent was common at midslope locations,
and night time RH recovery seldom exceeded 60 to 65 percent.
Night time inversions in the Salmon River drainage commonly produce a thermal belt effect at midslope elevations, promoting active burning conditions at night. Thermal belts were present on July 20 and 21, and resulted in active burning on the Cramer fire well into the late evening and early morning on these nights.
Remote Automated Weather Stations (RAWS) are located on seven sites on the forest and are routinely used to track weather and fire danger trends (figure 8). The Skull Gulch RAWS was in the location most representative of the Cramer Fire, but was found to have a bad temperature/ humidity sensor during the initial stages of the Cramer Fire. It was also found to have a programming error that resulted in improper reporting of wind speeds. As a result, all data for the Skull Gulch RAWS was considered to be inaccurate and unusable. Of the remaining stations, Indianola (elevation 3400 feet) best represented weather conditions at the lower elevations of the Cramer Fire (H-1 and lower Cramer Creek), and Lodgepole (elevation 6100 feet) represented midelevation conditions reasonably well (H-2 and upper Cramer Creek).
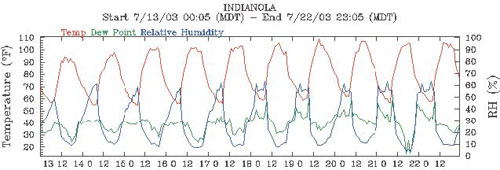
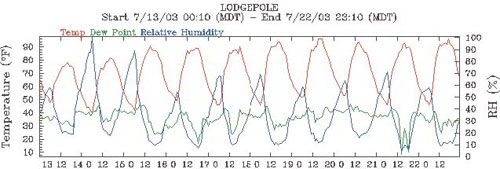
Figure 8—Temperature
and relative humidity trends produced by the Indianola and Lodgepole RAWS
10 days before the fire.
Windspeeds and Direction
A large ridge of high pressure dominated central Idaho in mid
to late July with a thermal trough of low pressure at the surface. Prior
to July 22, 2003, the surface wind pattern was diurnal in nature with
thermally induced slope and valley wind components.
Forecast models for the day of July 22, 2003 indicated that a weak “short wave,” or weather disturbance, could move through the area. This would change the typical diurnal wind pattern to a more synoptic or large-scale pressure pattern with northwest- to-west winds over central Idaho. This would especially be evident in westto- east or northwest-to-southeast-oriented valleys and drainages. This change in wind patterns was reflected in the fire weather forecast for zone 405 issued the morning of the 22nd, which forecast northwest winds 5 to 15 mph (figure 9).
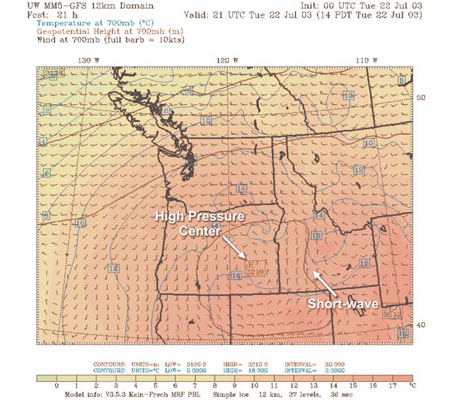
Figure 9—Shortwave
disturbance and associated winds forecast for July 22, 2003.
Wind observations taken from the RAWS sites at Lodgepole and Indianola indicated the 20-foot, 10-minute average winds had turned west to northwest late in the afternoon. Afternoon and early evening 20-foot, 10-minute average windspeeds ranged from 2 to 11 mph at the Indianola RAWS site and from 6 to 14 mph at the Lodgepole RAWS site. This would result in one-minute-maximum peak eye-level windspeeds from 15 to 19 mph with possible gusts of 23 to 28 mph.
The afternoon upper-air sounding (figures 10a and 10b) taken at 0800 and 1800 MDT at Great Falls, MT, also indicated that surface wind directions had changed that afternoon to westerly in the lower levels, indicating a weak trough passage. Windspeeds were 5 to 15 knots (6 to 17 mph) below 12,000 feet mean sea level.
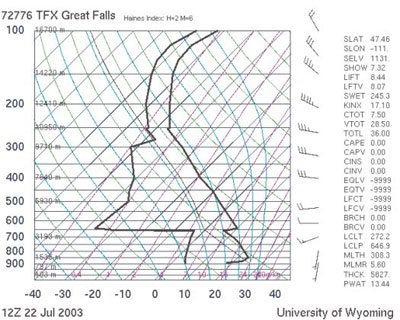
Figure 10a—Upper-air
soundings (skew-t) from Great Falls, MT, at 0800 MDT.
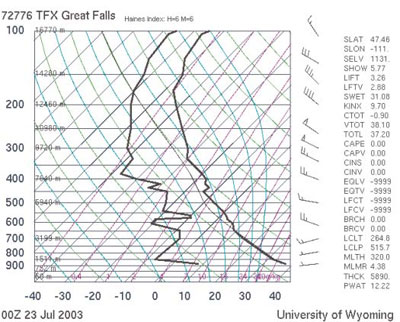
Figure 10b—Upper-air
soundings (skew-t) from Great Falls, MT, at 1800 MDT, indicating a trough
passage.
Temperature and Relative Humidity
Temperatures for the previous 90-day period indicated surface
temperatures in the area of the fire to be 3 to 6 °F warmer than normal.
The week previous to the start of the Cramer Fire, Long Tom Lookout recorded
an afternoon high temperature of 87 °F on Saturday, July 19th. Afternoon
high temperatures for the period of July 20–22, 2003, at the Lodgepole
and Indianola RAWS sites were in the mid-90s to low 100s with overnight
lows in the mid-40s to low 50s at Lodgepole and in the lower 50s at Indianola.
The RAWS relative humidity (RH) data for July 20 through 22 indicated night time humidity recovery of 60 to 70 percent, although humidity values remained less than 60 percent until around sunrise on the mornings of the 20th through the 22nd. This, combined with the warm overnight temperatures in the thermal belt, contributed to a longer night-time period of active burning. The minimum afternoon RH at Indianola and Lodgepole on the 20th were 10 to 15 percent respectively, dropping to 3 and 4 percent on the 21st, and at 8 percent at both sites on the 22nd. Figures 11a, 11b, and 11c show detailed temperature and RH data.
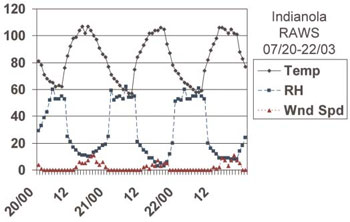
Figure 11a—Temperature
and relative humidity data from the Indianola RAWS site for the first
3 days of the Cramer Fire.
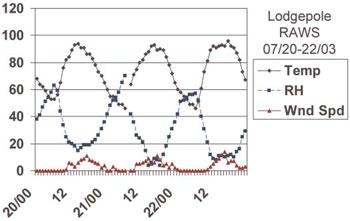
Figure 11b—Temperature
and relative humidity data from the Lodgepole RAWS site for the first
3 days of the Cramer Fire.
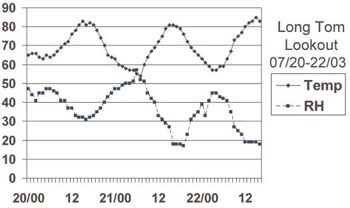
Figure 11c—Temperature
and relative humidity data from the Long Tom Lookout RAWS site for the
first 3 days of the Cramer Fire.
Seasonal Severity and NFDRS Indices
The forest uses the Energy Release Component (ERC) of the National
Fire Danger Rating System (NFDRS) for initial fire sizeup, complexity
analysis, and management response. It also uses the Burning Index
(BI) as a standard index for predicting general fire behavior on
the forest. The ERC relates to the potential available energy per unit
area in the flaming front of a fire, while the BI reflects the potential
fire intensity and difficulty of control. The BI is somewhat sensitive
to changes in weather conditions, and the ERC much less so.
In July 2003, the overall BI level on the forest was well above the 90th percentile, and the ERC was in the 96th percentile, indicating extreme burning conditions. Both the Indianola RAWS (NFDRS fuel model C, open pine stands with grass understory) and Lodgepole RAWS (NFDRS fuel model G, dense conifer stands) indexes also indicated extreme burning conditions. ERC values for both stations were well above the 97th percentile, and for the previous three weeks, the Lodgepole ERC had been at or near the historical extreme. The Indianola station showed the BI to be at the 95th percentile, and for Lodgepole, the BI was well above the 97th percentile. Calculated 1,000-hour fuel moistures were 8 and 9 percent respectively, and for the previous month, had been at or near the historic extremes. Figures 12a, 12b, and 12c show graphs of NFDRS indexes from the Indianola and Lodgepole RAWS.
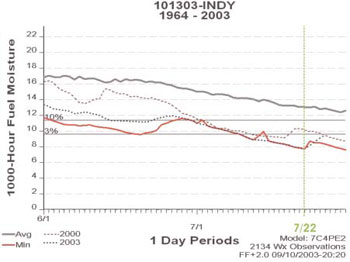
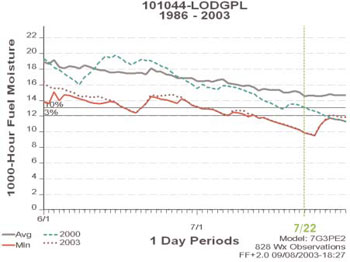
Figure 12a—Fuel
moisture graphs from the Indianola and Lodgepole RAWS sites (2000 is included
for comparison).
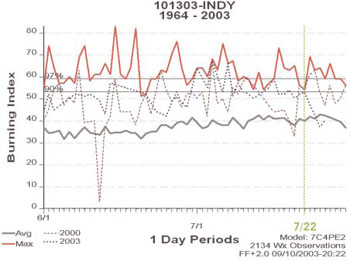
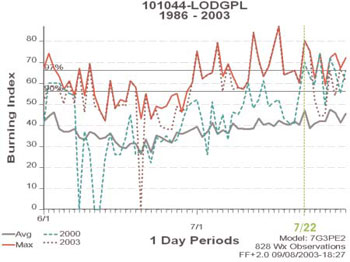
Figure 12b—BI graphs from the Indianola and Lodgepole RAWS sites
(2000 is included for comparison).
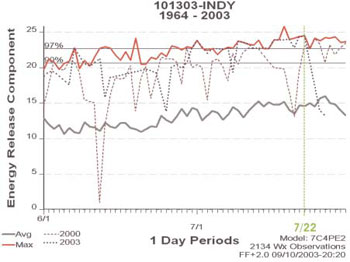
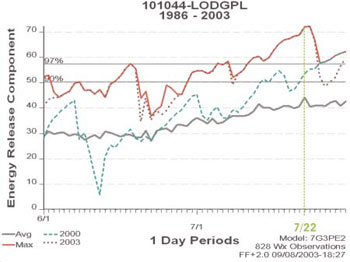
Figure 12c—ERC graphs from the Indianola and Lodgepole RAWS sites
(2000 is included for comparison).
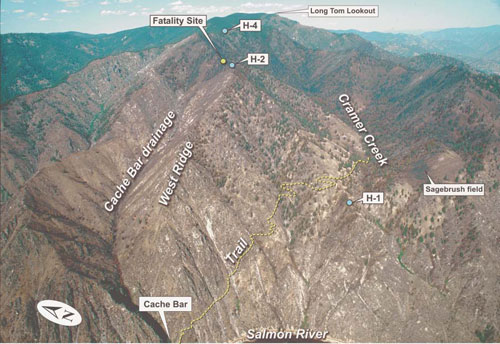
Topography
The Salmon River Breaks along the Salmon River are characterized as steep,
dry, and rugged, with limited visibility because there are steep areas
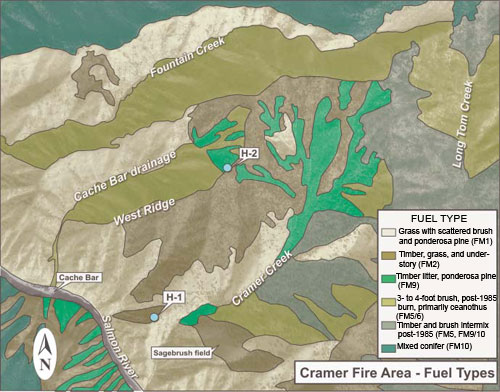
with very pronounced relief. Slope in much of the Cramer Fire area exceeds
60 percent, with more moderate slopes limited largely to the bottom of
the Cramer Creek drainage (figure 13). These steep areas are predisposed
to rapid uphill fire spread, problems with rolling firebrands, and extreme
fire behavior under dry conditions. The topography also has a strong influence
on surface winds, and thermally-induced diurnal slope and canyon winds
are the norm. Additionally, night time inversions in the deep river canyon
of the Salmon River often create a thermal belt effect at midslope, causing
fires to remain active into the night and early morning (figure 14).

Figure 13—Slope
classes (percent) in the Cramer Fire area.
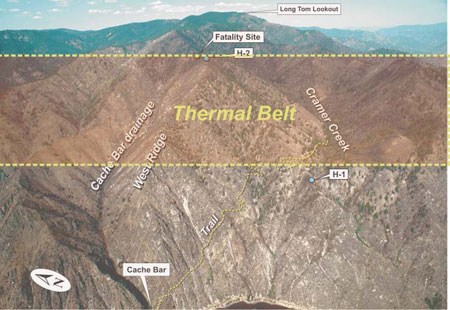
Figure 14—Schematic diagram of the general thermal-belt location
in the Cramer Fire area.
| ©2004-2006 Colorado Firecamp, Inc. | home • schedule • blog • ENGB • facility • about us• FAQ's |